Why Most Chart Patterns Fail in Crypto
do chart patterns work in crypto
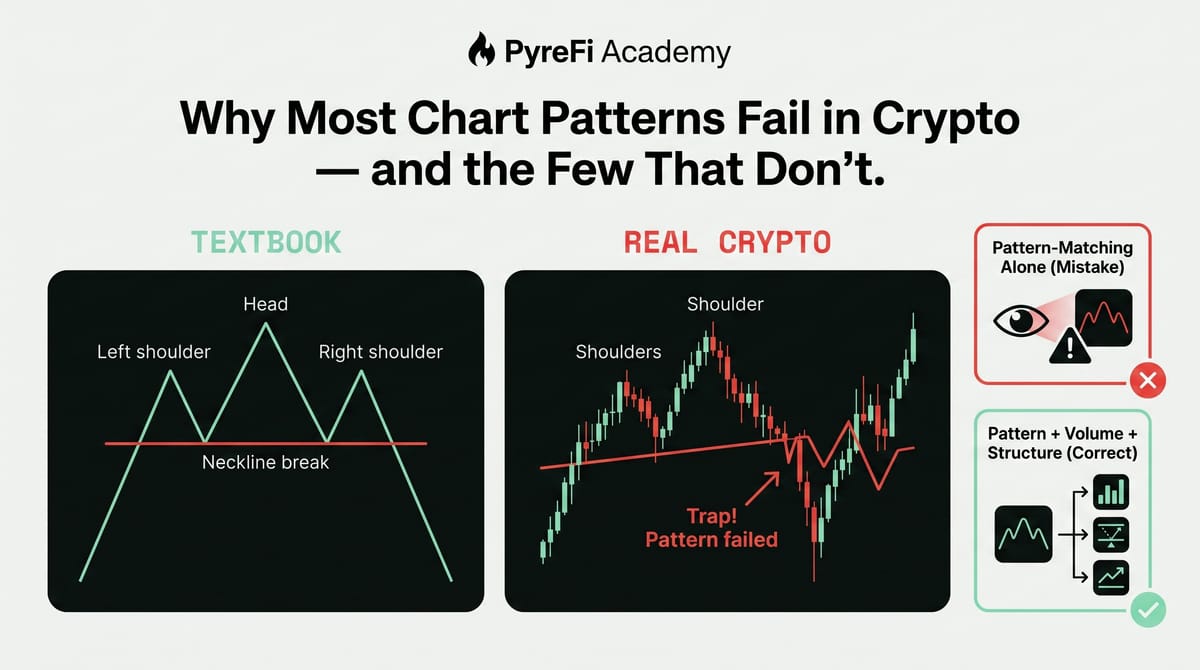
Textbook patterns were built for a slower, cleaner world. Here's what survives contact with crypto.
Open any classic technical analysis book and you'll find a zoo of chart patterns: head and shoulders, double tops, pennants, wedges, cup and handle, and dozens more. They're drawn as clean, elegant shapes with confident arrows showing exactly where price will go. Then you try to trade them in crypto, and they fail — constantly.
This isn't because you're bad at spotting them. It's because most textbook chart patterns were developed for slower, more regulated, less manipulated markets, and crypto breaks many of the assumptions they rely on. Understanding why they fail tells you which few actually survive — and how to trade even those with the skepticism crypto demands.
Why crypto is hostile to textbook patterns
Several features of crypto markets specifically undermine classic pattern trading.
1. Extreme volatility shreds clean shapes. Textbook patterns assume relatively orderly price action. Crypto's violent, sudden moves distort patterns beyond recognition — a "neckline" gets pierced by a wick and reclaimed in minutes, a "triangle" explodes before it completes. The tidy geometry rarely holds.
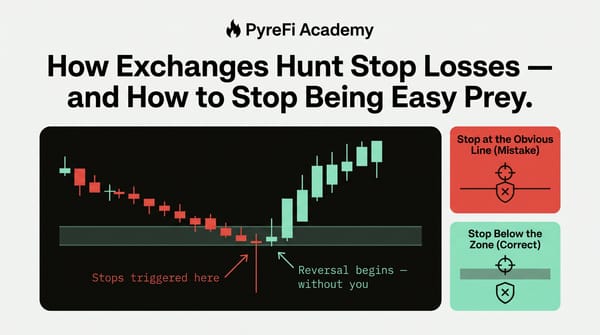
2. Thin liquidity enables manipulation. Many crypto markets have shallow order books, especially outside the largest caps. This makes it cheap for large players to push price around — including deliberately faking the breakout or breakdown that a pattern predicts, triggering the clustered stops of pattern traders, then reversing. Patterns become bait.
3. 24/7 markets have no reset. Traditional markets close, creating natural pauses, gaps, and session structure that patterns partly rely on. Crypto never closes. Patterns that assumed daily open/close rhythms lose part of their logic.
4. Everyone sees the same patterns. Classic patterns are so widely taught that they've become predictable — and predictable things get exploited. When thousands of traders place the same order at the same "textbook" level, that cluster becomes an obvious target for a liquidity grab. The pattern's popularity is its weakness.
5. Narrative and news dominate. Crypto moves violently on tweets, listings, hacks, and hype cycles. A perfectly formed pattern is worthless when a single piece of news overwhelms the technicals entirely.
The pattern that fails most: precise, complex shapes
The patterns that fail hardest in crypto are the intricate, multi-part ones that require price to trace an exact shape over a long period — elaborate head-and-shoulders formations, complex harmonic patterns with precise Fibonacci ratios, and anything that depends on price respecting geometry to the dollar. Crypto's noise and manipulation simply don't allow that level of precision to hold reliably. The more specific and delicate the pattern, the more ways it has to fail.
The few patterns that actually survive
Not all patterns are equal. The ones that hold up in crypto share a common trait: they reflect a genuine market dynamic — a real shift in supply and demand — rather than a fragile geometric shape. Here are the survivors.
1. Consolidation-then-breakout (ranges and squeezes). This is the most robust pattern in crypto because it reflects real behavior: price coils tightly as volatility contracts (buyers and sellers reaching temporary equilibrium), then expands violently when one side wins. Whether you call it a range, a triangle, or a Bollinger Band squeeze, the underlying dynamic — energy building during compression, releasing on expansion — is real and recurring. Trade it by waiting for a confirmed, high-volume break of the range, ideally with a retest, rather than anticipating the direction.
2. Support/resistance flips. Not a "pattern" in the classic sense, but the most reliable structural behavior there is. A key level that breaks and then holds on the retest (old resistance becoming support, or vice versa) reflects a genuine change in where the market values the asset. It works because it's rooted in structure, not geometry.
3. Simple double tops and double bottoms — with confirmation. These survive better than complex patterns because they represent a clear, real dynamic: price tests a level twice and fails (double top = buyers can't break resistance twice; double bottom = sellers can't break support twice). They're simple enough to be robust, but only when confirmed by a break of the intervening structure and supportive volume. Traded on the pattern alone, they still fail often.
4. Trend continuation after a pullback. In a strong trend, price pulls back, consolidates briefly, and resumes. This "flag"-like behavior works because it aligns with the dominant trend — the highest-probability context in trading. You're not betting on a shape; you're betting on an established trend resuming, with the consolidation just offering a better entry.
Notice the common thread: the surviving patterns all describe a real supply-and-demand dynamic and all demand confirmation. They're not magic shapes; they're readable behaviors, traded with skepticism.
How to trade patterns in crypto without getting trapped
- Prefer simple over complex. The more elaborate the pattern, the more likely crypto's noise breaks it. Favor ranges, flips, and clean double tops/bottoms over intricate formations.
- Demand confirmation — always. Never trade a pattern on anticipation. Wait for the confirming break and the volume that validates it. Where possible, wait for the retest. This filters out most manipulated fakeouts.
- Weight volume heavily. A pattern breakout without volume is a trap in waiting. Genuine moves bring participation.
- Align with the higher-timeframe trend. A pattern pointing the same direction as the dominant trend is far more trustworthy than one fighting it.
- Respect liquidity. Patterns on liquid, major assets are more reliable than on thin small-caps where manipulation is trivial. Be extra skeptical of "perfect" patterns on obscure tokens.
- Never ignore the news context. A beautiful bearish pattern means nothing if a major bullish catalyst is about to drop. Technicals and fundamentals coexist.
The systematic advantage
This is another area where automated market-intelligence has an edge over eyeballing charts. Rather than pattern-match shapes (which is subjective and easily fooled), systematic approaches focus on the underlying dynamics the good patterns represent — volatility contraction and expansion, confirmed breaks with real volume, structural flips, trend continuation — and validate them with independent data like liquidity and derivatives positioning. It's the difference between "this looks like a head and shoulders" and "compression is resolving into a high-volume, liquidity-confirmed expansion." The latter survives crypto; the former often doesn't.
The takeaway
Most chart patterns fail in crypto not because technical analysis is useless, but because crypto violates the assumptions those patterns were built on — it's too volatile, too thin, too manipulated, too public, and too news-driven for delicate geometry to hold. The patterns that survive are the ones grounded in real supply-and-demand dynamics: consolidation-then-breakout, support/resistance flips, simple double tops and bottoms, and trend continuation after a pullback — and even those demand confirmation and volume before you trust them.
Trade the dynamic, not the drawing. Demand proof before you act. And treat any pattern that looks too textbook-perfect on a thin token as exactly what it usually is: bait.
PyreFi focuses on the market dynamics behind reliable patterns — confirmed, volume-backed, liquidity-aware moves — rather than pattern-matching fragile shapes that crypto routinely breaks.