The Derivatives Cheat Sheet: 6 Metrics to Check Before Every Trade
crypto derivatives metrics checklist
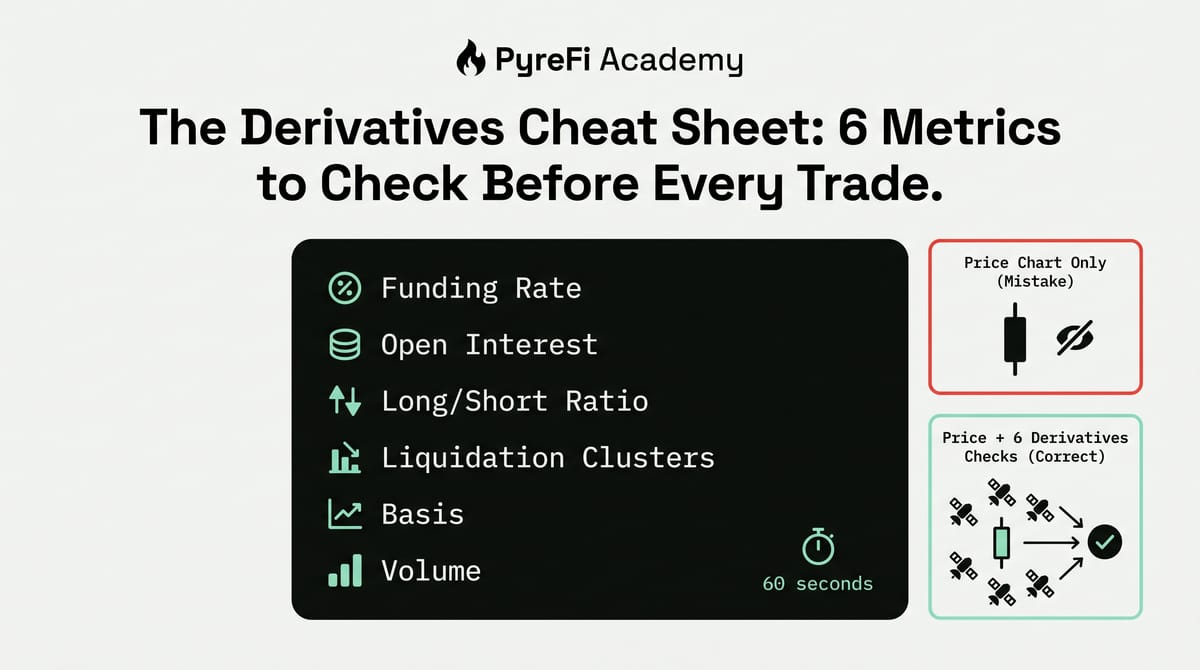
A 60-second pre-trade routine that reveals the positioning and fragility hiding beneath the price.
Most traders make a decision by looking at one thing: the price chart. But in crypto, where derivatives often drive price discovery, the chart is only half the story. The other half — the positioning, the leverage, the fragility hiding beneath the candles — lives in derivatives data. And you can check the essentials in about sixty seconds before every trade.
This article is a practical cheat sheet: six derivatives metrics to glance at before you enter, what each tells you, and how to read them together. Think of it as the pre-flight checklist that keeps you from walking into a squeeze or a cascade blind.
Why a derivatives check matters
Price tells you where the market is. Derivatives data tells you how it got there and how stable it is. A rally with healthy positioning is very different from an identical-looking rally sitting on a mountain of crowded leverage about to unwind. The chart can't distinguish them. The derivatives data can. Running this checklist turns you from a price-only trader into one who sees the mechanics.
Here are the six.
1. Funding rate — "which way is the crowd leaning, and are they paying for it?"
What it is: The periodic payment between longs and shorts on perpetual futures.
How to read it: - Positive funding → market crowded long (longs paying shorts). - Negative funding → market crowded short (shorts paying longs). - Near zero → balanced. - Extreme funding (either way) → crowded, fragile positioning primed for a squeeze in the opposite direction.
Before a trade: If you're about to go long into extremely positive funding, know you're joining a crowded, fragile long side. If you're shorting into extreme negative funding, you're joining crowded shorts vulnerable to a squeeze. Extreme funding = extra caution.
2. Open interest — "how much leverage is loaded?"
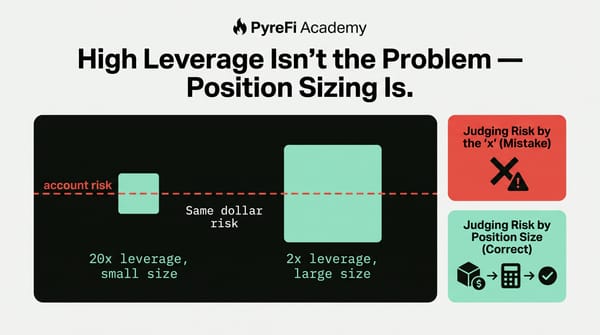
What it is: The total number of outstanding derivative contracts — the amount of leverage currently in the market.
How to read it (with price direction): - Price up + OI up → strong conviction (new longs). Healthy. - Price up + OI down → weak rally (short covering). Suspect. - Price down + OI up → strong conviction (new shorts). Real downtrend. - Price down + OI down → capitulation (longs exiting). Possible exhaustion. - Very high OI → lots of leverage loaded = elevated squeeze/cascade risk.
Before a trade: Check whether OI confirms the move you're trading. A breakout on rising OI has fuel; on falling OI, it's likely covering and may fizzle.
3. Long/short ratio — "how lopsided is positioning?"
What it is: The ratio of long to short positions (by accounts or by size — know which you're looking at).
How to read it: - Balanced → no strong crowd lean. - Heavily lopsided → crowded positioning, potential contrarian warning at extremes. - Watch for divergence between the accounts ratio (retail) and the position-size ratio (big money).
Before a trade: Use it to corroborate funding and OI, not alone. Extreme lopsidedness plus extreme funding plus high OI = genuinely crowded and fragile. Alone, it's weak — and don't fade a strong trend on the ratio by itself.
4. Liquidation levels/heatmap — "where are the magnets?"
What it is: A view of where large clusters of liquidation prices sit above and below current price.
How to read it: - Dense clusters are magnets — price often gets drawn toward them because that's where liquidity is. - A cluster above → short liquidations → potential upside squeeze fuel. - A cluster below → long liquidations → potential downside cascade fuel.
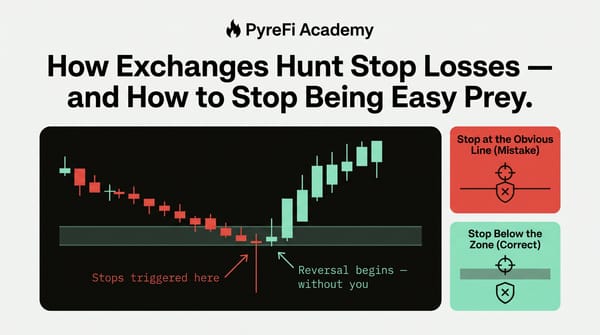
Before a trade: Know where the nearby clusters are. If you're going long but there's a dense long-liquidation cluster just below, recognize price may get pulled down to flush it first. Don't place your stop right inside a cluster.
5. Basis (perp vs. spot spread) — "how stretched is leverage vs. reality?"
What it is: The difference between the perpetual futures price and the spot price.
How to read it: - Large positive basis → perps trading well above spot → aggressive leveraged bullishness → fragility. - Negative basis → perps below spot → bearish leverage lean. - Near zero → leverage and spot roughly aligned.
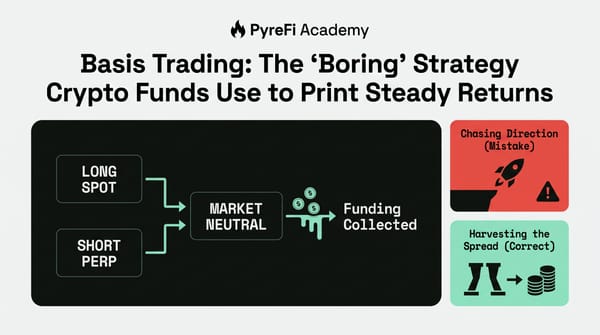
Before a trade: A large basis warns that leverage is stretched relative to actual spot demand — the move is derivatives-driven and potentially prone to snapping back. Sustainable moves usually have spot participation, not just perp froth.
6. Volume (spot and derivatives) — "is there real participation?"
What it is: How much actually traded — ideally checked on both spot and derivatives, across reputable venues.
How to read it: - High volume → genuine participation, more trustworthy move. - Low volume → thin conviction, more likely a fakeout. - Be skeptical of volume on obscure venues (potential wash trading); cross-check across exchanges.
Before a trade: Confirm the move you're trading has real volume behind it. A breakout without volume is a trap waiting to spring.
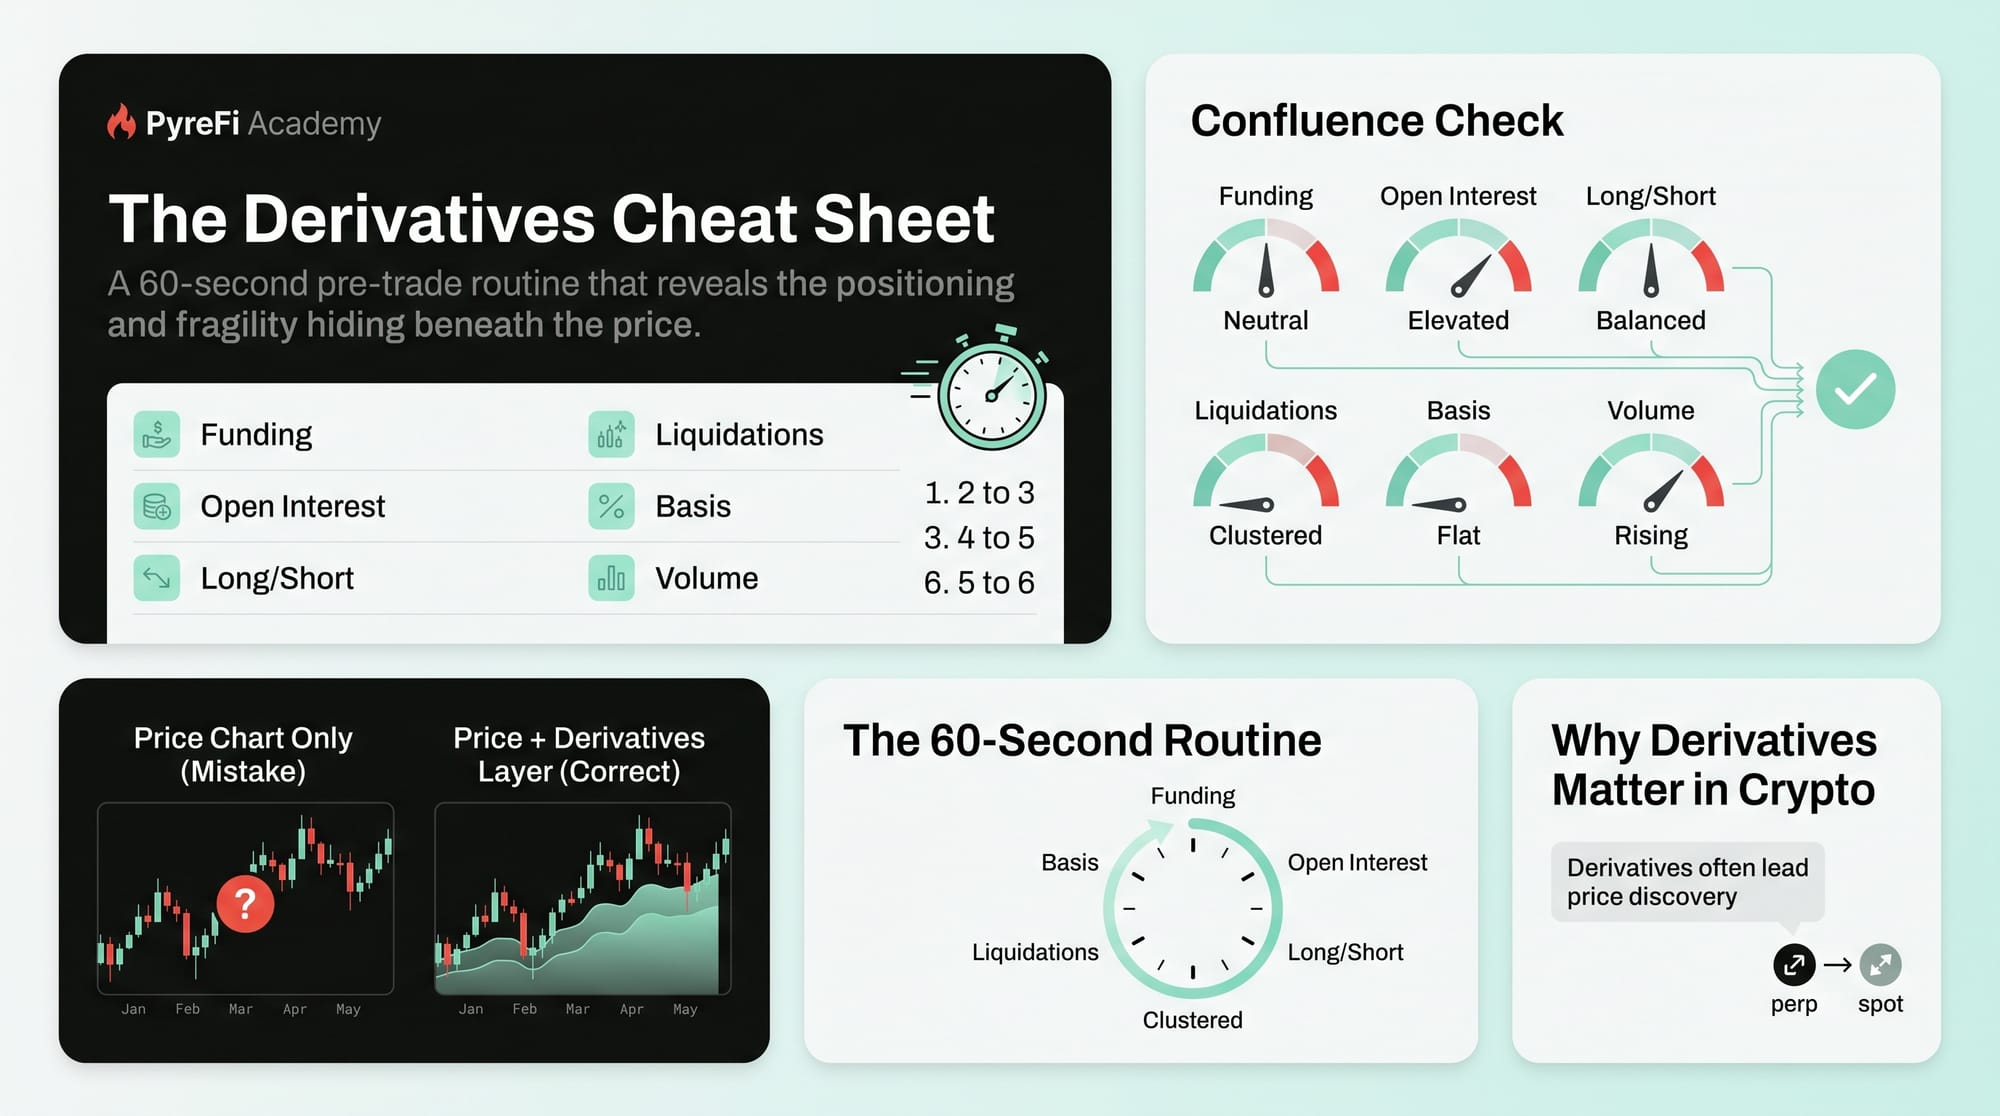
Reading them together: the 60-second routine
Individually, each metric is a clue. Together, they tell a coherent story. Run them in sequence before a trade:
- Funding — is the crowd stretched?
- Open interest — is there conviction or is leverage dangerously loaded?
- Long/short ratio — how lopsided, and does retail disagree with big money?
- Liquidation clusters — where are the magnets relative to my entry and stop?
- Basis — is this move real (spot-backed) or leveraged froth?
- Volume — is there genuine participation?
The composite read might be: "Extreme positive funding + very high OI + heavily long ratio + a dense long-liquidation cluster just below + wide basis + declining volume" — that's a screaming warning that a long here is joining a crowded, over-leveraged, froth-driven position primed to cascade downward. The price chart alone would never tell you that. Conversely, "neutral funding + rising OI + balanced positioning + real volume + tight basis" describes a healthy, well-supported move worth trusting.
The habit that changes your trading
The point isn't to master derivatives trading — it's to build a habit. Before every meaningful trade, spend sixty seconds on these six metrics. Over time, you'll develop an intuition for when the derivatives backdrop supports your trade and when it's screaming danger. You'll avoid entering longs into over-funded, over-leveraged tops and shorts into squeeze-primed bottoms. You'll stop being surprised by the violent moves, because you'll have seen the fragility building.
Why systematic tools help
Checking six metrics across many assets, continuously, by hand is impractical — which is exactly why market-intelligence systems automate it. A platform monitoring funding, OI, positioning, liquidations, basis, and volume across the full market can flag when an asset's derivatives backdrop is dangerously stretched or healthily supported, folding that context into its read of every token. It's this cheat sheet, run automatically on everything at once. But even doing it manually on the one asset you're about to trade puts you ahead of the price-only crowd.
The takeaway
The price chart is half the picture. The other half — positioning, leverage, and fragility — lives in derivatives data: funding, open interest, the long/short ratio, liquidation clusters, basis, and volume. Six metrics, sixty seconds, before every trade. Read together, they reveal whether the move you're about to trade is healthy and supported or crowded and primed to snap.
Make the check a habit. It's the difference between trading the shadow and trading the source.
PyreFi monitors this full derivatives checklist across the entire market continuously, folding positioning and fragility context into its read of every token — the cheat sheet, automated on everything at once.