The Anatomy of a Short Squeeze: Reading the Data Behind Crypto's Violent Rallies
short squeeze crypto explained
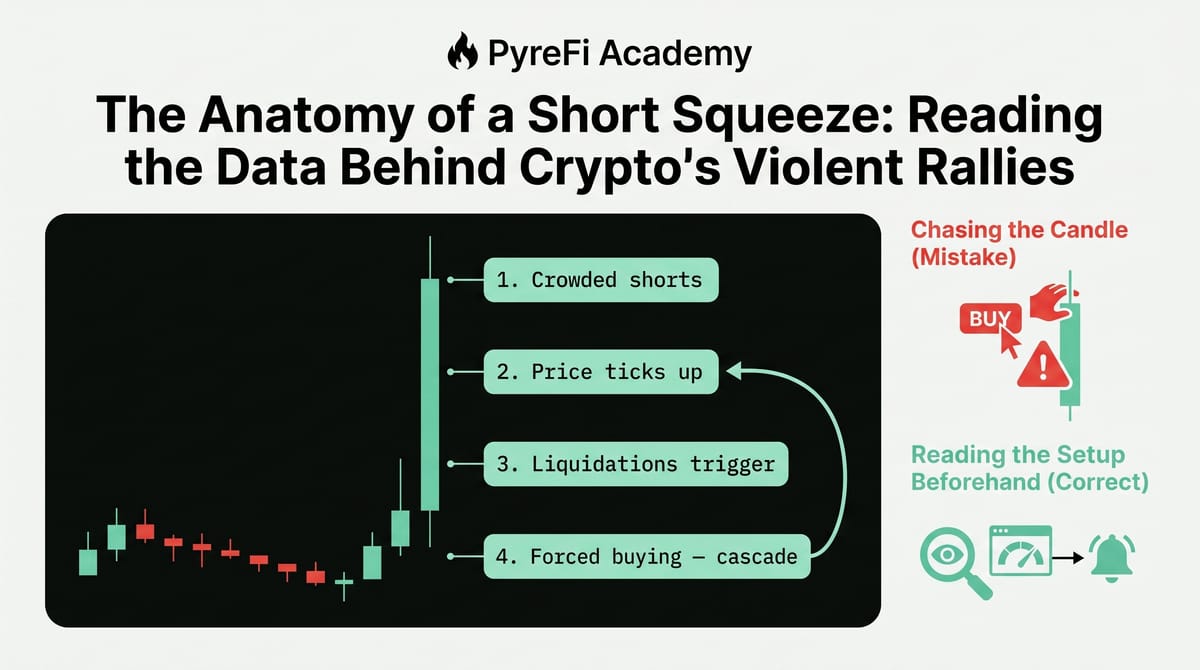
Some of crypto's fastest rallies aren't buying — they're forced covering. Here's how to read one building.
Sometimes a crypto asset rips upward with a violence that seems disconnected from any news — a near-vertical green candle, 20% or more in minutes, catching everyone flat-footed. It looks like a wave of euphoric buying. Often, it's the opposite: it's a wave of forced buying by traders who were short and got squeezed out. This is a short squeeze, and it's one of the defining dynamics of crypto's violent rallies.
Understanding the anatomy of a short squeeze lets you avoid being its victim and, sometimes, position for it. It's the upside mirror of a liquidation cascade, driven by the same mechanics of leverage and forced orders.
The setup: crowded shorts
A short squeeze needs fuel, and the fuel is crowded short positioning. Here's how it accumulates:
An asset has been falling or is widely expected to fall. Traders pile into short positions to profit from (or hedge against) the decline. As more traders short, the market becomes lopsided — heavily positioned to the downside. Each short is a leveraged bet that price will drop, and each has a liquidation price above the current price (shorts lose money as price rises).
Because retail tends to crowd into the same trades, these short liquidation prices cluster together in zones above the current price. The market is now a loaded spring: a large pool of leveraged shorts, all vulnerable to an upside move, with their liquidation prices bunched up.
The trigger and the feedback loop
Now something pushes price up — a piece of good news, a large buyer, or simply price rising into the first cluster of short liquidation levels. The squeeze mechanism ignites:
- Trigger: Price rises enough to hit the first cluster of short liquidation prices.
- Forced buying: Those shorts get liquidated. Closing a short means buying — so the exchange's engine dumps forced buy orders onto the market.
- Price pushed higher: That forced buying drives price up further.
- Next cluster hit: The higher price triggers the next cluster of short liquidations.
- More forced buying: Which pushes price even higher...
- Repeat and accelerate: Each wave of liquidations fuels the next.
On top of the mechanical liquidations, discretionary shorts panic. Seeing price rip against them and fearing liquidation, they voluntarily buy back their positions to cut losses — adding more buying pressure. The forced and the fearful pile in together.
The result is a self-reinforcing upward cascade: rising price forcing shorts to buy, which raises price, which forces more shorts to buy. That's why the candle goes vertical — it's not organic demand, it's a chain reaction of covering. And like a downside cascade, it typically overshoots and then partially retraces once the shorts are flushed, leaving a long upper wick.
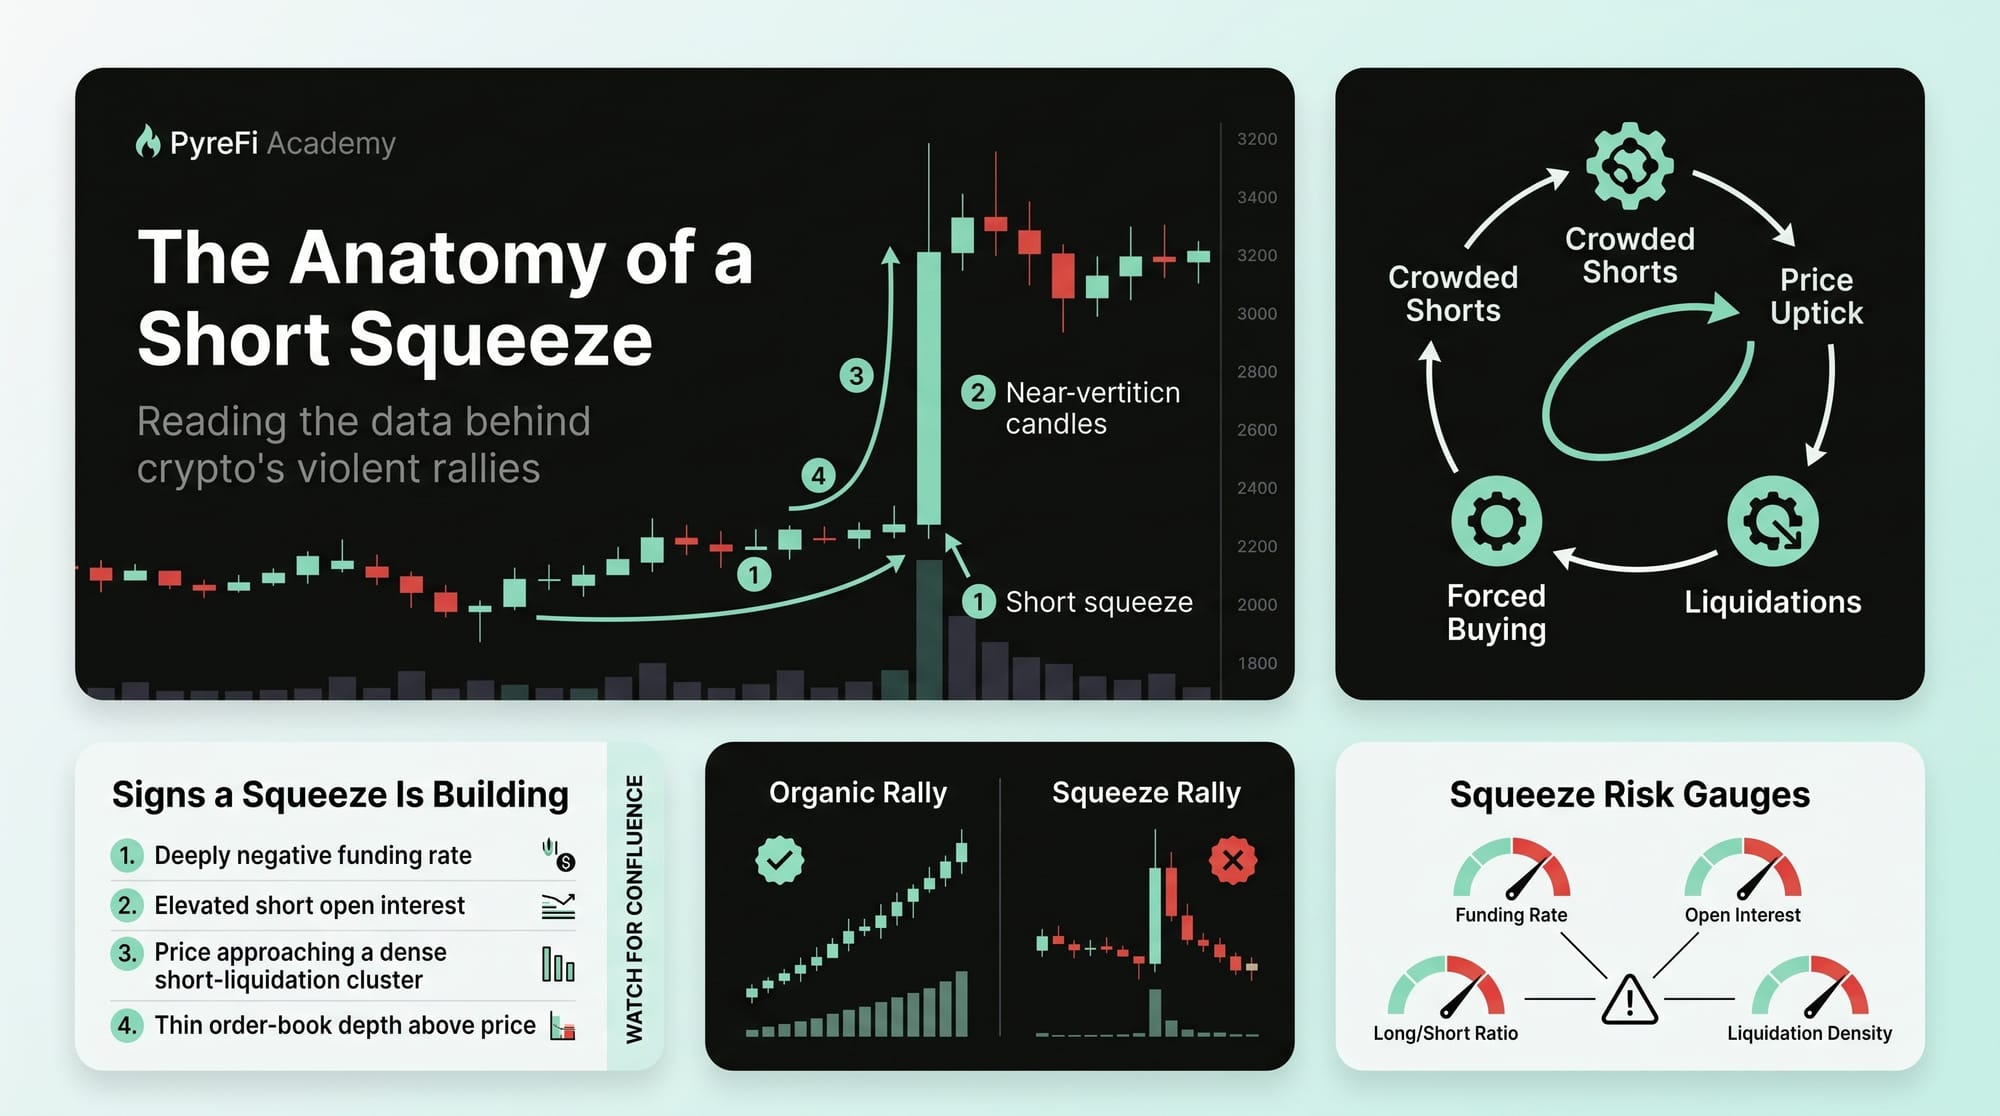
Reading a squeeze building in the data
The beauty of derivatives data is that you can see the conditions for a squeeze before it fires. The warning signs:
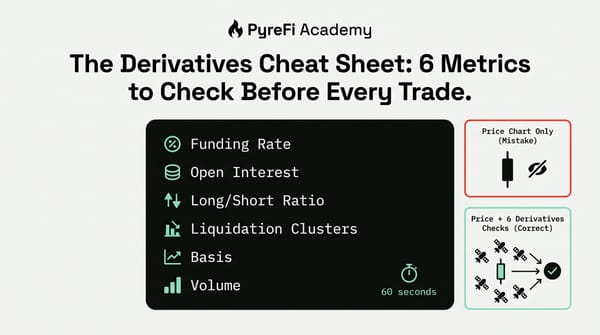
1. Extreme negative funding. Negative funding means shorts are paying longs — the market is crowded short. Very negative funding is a flashing sign that short positioning is stretched and squeeze-prone. (Positive funding extremes warn of the opposite: a long squeeze / downside cascade.)
2. High open interest during a decline or at a bottom. High OI means lots of leverage loaded. If it built up while price fell, much of it is likely short positioning — ammunition for an upside squeeze.
3. Short-heavy long/short ratio. When positioning data shows the crowd heavily short (read carefully, and ideally corroborated by funding and OI), the fuel is present.
4. Price coiling below a cluster of short liquidations. When price is grinding just beneath a dense zone of short liquidation levels, that zone becomes a magnet — a break into it can ignite the squeeze.
The composite: extreme negative funding + high OI + crowded shorts + price approaching a short-liquidation cluster = a market primed to squeeze upward. You can't time the exact trigger, but you can recognize the loaded spring.
How to use this knowledge
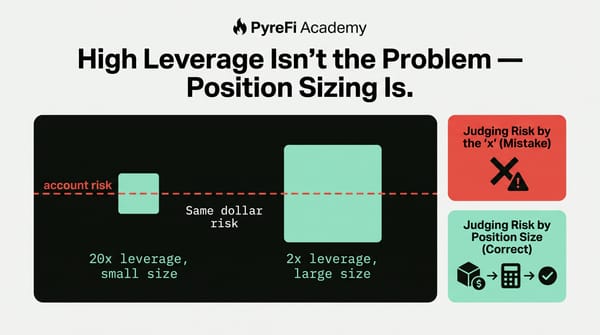
1. Don't be a crowded short. The most important lesson. If funding is extremely negative and everyone is short, recognize your short is part of the vulnerable pile. That's the setup where a squeeze wipes out shorts. Reduce size, use less leverage, or wait for a better spot.
2. Respect the counter-trend squeeze risk. Even in a genuine downtrend, violent short squeezes erupt regularly — they're how the market flushes over-eager bears before continuing down. Shorting into extreme negative funding without a plan is how bears get liquidated even when they're ultimately "right" about direction.
3. Consider positioning for the squeeze. More advanced traders watch for the setup and position long into a likely squeeze — buying as price approaches the liquidation cluster with a defined stop, aiming to ride the forced-buying spike. High risk, requires precision, but it's how some traders turn the squeeze mechanic to their advantage.
4. Recognize the overshoot. A squeeze rally often massively overshoots fair value on the forced buying, then snaps back. Don't chase the top of a vertical squeeze candle — that's where the covering exhausts and the retrace begins. The FOMO buyer at the top becomes exit liquidity for the squeeze.
Squeeze vs. genuine rally
A key skill is distinguishing a short squeeze from a genuine, sustainable rally. Clues:
- A squeeze is driven by forced covering — you'll see it coincide with a sharp drop in open interest (shorts closing) and often a violent overshoot followed by retrace. It's fueled by the exit of bears, not the conviction of bulls.
- A genuine rally shows rising open interest (new longs entering with conviction) and holds its gains rather than immediately retracing.
Reading OI during the move tells you whether you're watching real demand or a leverage flush. This is the same "price up + OI down = weak rally" logic from open-interest analysis, playing out in real time.
Why systematic monitoring wins here
Spotting squeeze conditions requires watching funding, open interest, positioning, and liquidation clusters across the whole market simultaneously — a natural fit for automated market-intelligence. A system monitoring the full derivatives surface can flag when an asset's short positioning is dangerously stretched and primed to squeeze, across many tokens at once, long before the vertical candle appears. It turns the invisible buildup of crowded shorts into a readable, early signal — the same read a sharp human does on one chart, scaled to everything.
The takeaway
A short squeeze is a self-reinforcing upward cascade driven by forced and panicked short covering, not genuine demand. It builds when short positioning becomes crowded — visible in extreme negative funding, high open interest, and short-heavy positioning — and ignites when price rises into clustered short liquidation levels. It overshoots, then retraces.
Don't be the crowded short that becomes the fuel. Read the derivatives data to see the spring loading. And whether you avoid the squeeze or position for it, understand that some of crypto's most violent rallies are not buying at all — they're bears being forced to buy at exactly the wrong moment.
PyreFi monitors funding, open interest, and positioning across the market to flag when short positioning is stretched and squeeze-prone — surfacing the loaded spring before it fires.