RSI Is Lying to You: Why "Overbought" Doesn't Mean Sell in Crypto
RSI overbought crypto meaning
The most misused indicator in trading, and how to read it the way it was actually designed.
Here's a trade that has cost more crypto traders money than almost any other: RSI hits 70, a little label pops up saying "overbought," and you short — or you sell your bag — because overbought obviously means the top is in. Then the asset doubles.
The Relative Strength Index isn't broken. It's one of the most useful tools on a chart. But the way most people are taught to read it is not just incomplete — it's actively dangerous in trending markets, which is most of what crypto is. Let's fix that.
What RSI actually measures
RSI, developed by J. Welles Wilder, is a momentum oscillator. It compares the magnitude of recent gains to recent losses over a lookback period (14 candles by default) and outputs a value between 0 and 100. High readings mean price has been rising strongly relative to its recent range; low readings mean it's been falling strongly.
That's it. RSI measures the speed and strength of a move, not whether that move is "too much." The words "overbought" and "oversold" are labels someone slapped on the 70 and 30 thresholds decades ago, and they've been misleading traders ever since.
"Overbought" does not mean "about to fall." It means "rising fast." In a strong trend, rising fast is exactly what you'd expect — and it can continue for a very long time.
Why the classic reading fails in crypto
Wilder designed RSI for commodity markets in the 1970s — markets that spent a lot of time ranging. In a sideways market, RSI's mean-reversion logic works reasonably well: price gets stretched, snaps back, and the oscillator's extremes roughly mark the turns.
Crypto is different. Crypto trends violently and persistently. When a token enters a real uptrend, RSI can pin above 70 for days or weeks while price grinds higher the entire time. Every trader who shorted each "overbought" reading got run over, again and again, while the trend did exactly what trends do.
The lesson: an oscillator's extremes are only reliable in a range. In a trend, they lie. And the first job of any RSI user is to answer a prior question — is this market trending or ranging? — before the RSI reading means anything at all.
The readings that actually matter
Once you stop treating 70 and 30 as sell and buy buttons, RSI becomes genuinely powerful. Here's what to look for instead.
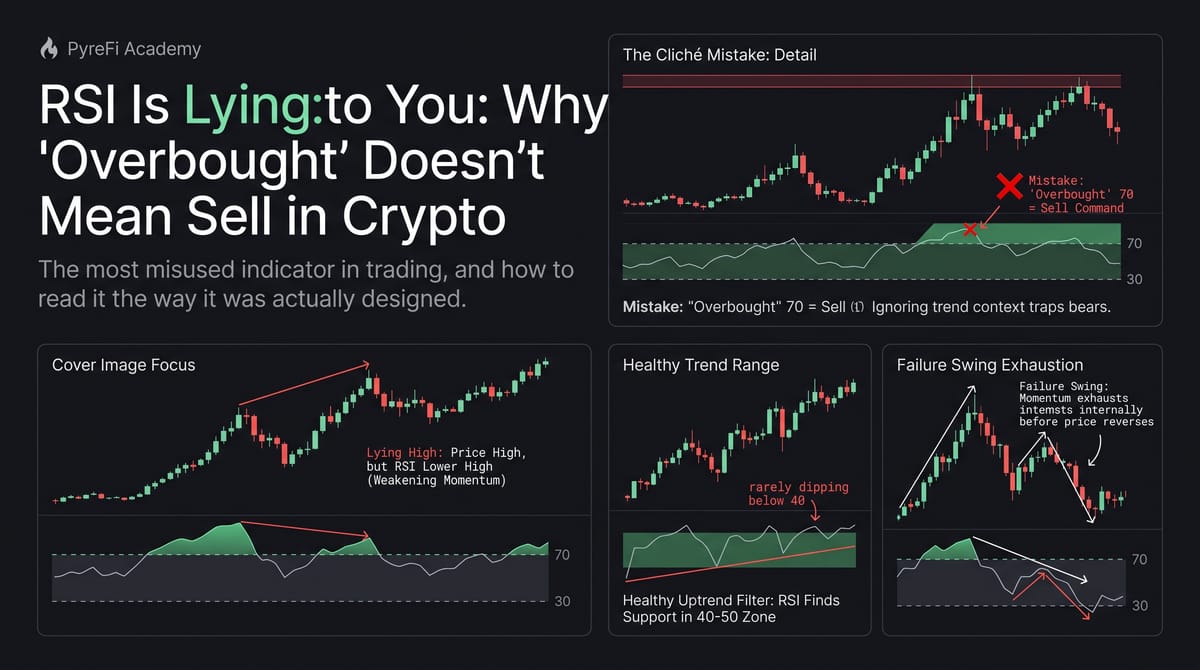
1. Divergence. This is RSI's highest-value signal. When price makes a higher high but RSI makes a lower high, the underlying momentum is weakening even as price rises — a bearish divergence. The reverse (lower price low, higher RSI low) is a bullish divergence. Divergences don't guarantee reversals, but they're a warning that the current move is running out of fuel. They're far more actionable than a raw threshold cross.
2. The 40–60 range as a trend filter. In a healthy uptrend, RSI tends to pull back to the 40–50 zone and bounce, rarely dipping below 40. In a downtrend, it rallies to 50–60 and rolls over, rarely exceeding 60. Watching where RSI finds support and resistance tells you the character of the trend. A break of that pattern — an uptrend's RSI suddenly slicing below 40 — is a real signal that momentum has shifted.
3. Failure swings. When RSI pushes to an extreme, pulls back, and then fails to reach that extreme again before breaking its recent low (or high), it's signaling exhaustion from within the indicator itself, independent of price. These are subtle but reliable.
4. Adjusting the thresholds to the regime. Some traders shift the bands to 80/20 in strong trends to filter noise, or use 60/40 in ranges to catch turns earlier. The point isn't the specific numbers — it's that the "right" thresholds depend on the market you're in.
A practical way to use RSI
Think of RSI as a context tool, not a trigger. Here's a workflow that respects what it actually does:
- First, classify the market. Is price making higher highs and higher lows (trend) or oscillating between two zones (range)? This decides everything.
- In a range, RSI extremes near 70/30 are meaningful — fade them with confirmation like a rejection candle at a known resistance zone.
- In a trend, ignore the extremes for entries. Instead, use RSI pullbacks to the 40–50 (up) or 50–60 (down) region to time entries in the direction of the trend.
- Always weight divergence heavily — especially on higher timeframes, where it's less noisy.
- Never trade RSI alone. Combine it with structure (support/resistance zones), volume, and ideally something orthogonal like derivatives data. Confluence turns a mediocre signal into a good one.
The deeper point: no single indicator is a strategy
RSI's bad reputation among experienced traders isn't really about RSI. It's about the seductive idea that a single number can tell you what to do. It can't. Every indicator is a lossy compression of price action, and each one throws away different information. RSI throws away context — it can't tell a range from a trend, so you have to supply that yourself.
The traders who profit with RSI are the ones who treat it as one voice in a chorus: momentum context that's only meaningful alongside structure, volume, and the broader market regime. The traders who lose with it are the ones who let a two-word label ("overbought") make their decisions for them.
Why regime-awareness scales
Deciding "trend or range?" for one chart is manageable. Doing it across hundreds of tokens, continuously, is not — which is exactly why systematic platforms don't read indicators in isolation. They evaluate momentum readings like RSI relative to each token's own recent behavior and the market's regime, so an "overbought" reading in a raging trend is treated completely differently from the same number in a dead range. That regime-relative reading is what turns a naive oscillator into something usable at scale — and it's the same discipline you can apply by hand on a single chart.
The takeaway
RSI isn't lying to you — the label is. "Overbought" means "rising fast," not "sell now." In crypto's persistent trends, blindly fading RSI extremes is one of the fastest ways to lose money. Read RSI for divergence, for where it finds support and resistance, and always within the context of whether the market is trending or ranging. Use it as context, never as a command.
Do that, and the indicator that's blown up so many accounts becomes one of the more honest tools on your chart.
PyreFi evaluates momentum for every token relative to its own history and the current market regime — so an "overbought" reading is judged in context, not by a fixed threshold.